Federated Learning for Firefox
To improve the Firefox URL bar, we used Federated Learning, a new privacy-preserving machine learning technique. Roughly 360,000 users helped to train and evaluate a model in a distributed way, and our results show that this optimization process worked well. This posts explains the decisions we made and shows the study results. Since Federated Learning is still a young technique, this is one of the very first implementations in a major software project.
Most of machine learning nowadays is based on collecting a lot of data which is then put on a powerful server where the training is performed. If the data is considered private by people, using machine learning this way is not possible or a bad idea. The entirely opposite approach, a completely decentralized system where individual models are trained for each user locally, generally works badly. Individuals by themselves often do not have enough data to fit good models.
Federated Learning is a new subarea of machine learning where the training process is distributed. The parts of the algorithm that touch the users’ data are executed locally on their machines. Instead of sharing data, clients then only send back abstract model improvements, for example weight updates, to the server. This way, a high-quality model can be trained collaboratively without needing to collect data. The Federated Learning blog post on this site provides a much broader overview of this area.
Over the past three months, we implemented a Federated Learning system for Firefox. The aim of this project was to improve part of the suggestions displayed in the Firefox URL bar, though in theory the system is flexible enough to be used in many other situations. Collecting local search queries and browsing histories is extremely bad for privacy, so using Federated Learning to still train a model on this data makes a lot of sense. Initially, we experimented with language models but then reduced the scope of the project to make it possible to implement everything in three months.
Search in the Firefox URL bar
The Firefox URL bar shows suggestions when users type a search query. A part of these suggestions is provided directly by a search engine. The others are generated by Firefox itself, for example based on the user’s history, bookmarks or open tabs. We tried to optimize the history and bookmark suggestions using our project.
 |
Searching for history and bookmark entries in the Firefox URL bar is a two-step process:
- The search query is matched against the browser history and bookmarks. Matching is a binary decision. Pages either match the query or do not
- The set of matched links is ranked based on the user’s history
Our project purely tries to optimize the ranking part of this process. Future work could tackle the problem directly from the query matching.
Learning to Rank
Before diving into the current implementation, it is worth taking a step back to understand how ranking in machine learning works. This makes it easier to see how the current algorithm fits into a machine learning system. Fundamentally, there are three different approaches to learning a ranking algorithm:
- Pointwise ranking: Each item is given separately to the model, which assigns a score to the item. The ranking is then determined by sorting all items using their respective scores. Essentially, this is a special type of a regression model since we are assigning a real number to every input
- Pairwise ranking: The model learns to compare pairs of items. Its task is to decide which of the two items should be ranked higher. Intuitively, this method can be motivated by the fact that the learned comparison function could then be used by various sorting algorithms. In this approach, we treat the problem as a classification task since the model can only have two possible outputs
- Listwise ranking: Instead of only working with individual items in each step, these methods try to operate on the entire list. The motivation behind this idea is that the evaluation metric can be optimized directly. In practice, this turns out to be fairly difficult because many evaluation metrics are not differentiable and the models need to work with many more inputs. Another difficulty is that the list could have an arbitrary length
All these approaches have different advantages and disadvantages. The existing ranking algorithm in Firefox is very similar to a pointwise ranking approach. Since this algorithm should be optimized using machine learning techniques, this gives us a clear set of techniques that could be useful in this project.
Frecency
The ranking of possible suggestions in the Firefox URL bar is determined using frecency, an algorithm that weights how frequently and recently a site was visited. To do this, a frecency score is assigned to each history entry and bookmark entry. After computing the score, it is cached. When searching, the matched results are then sorted using this score. This section introduces the existing frecency algorithm, while the next one explains how we planned to improve it.
Frecency does not only take frequency and recency into account but also other information, such as how the page was visited and whether it is bookmarked. It does this by looking at the latest visits to the respective site. The value \(\operatorname{visit}(v)\) of one single visit \(v\) is then defined by how recent that visit was, scaled by the type of visit:
\[\operatorname{visit}(v) = \operatorname{recency}(v) * \operatorname{type}(v)\]Frecency scores have to be cached in order to allow an efficient ranking while the user is typing. This means that the recency aspect has to be modeled using time buckets. Otherwise, the score would change all the time and caching would not work. In the current Firefox implementation, there are five time buckets. With this approach, the recency score only changes when a visit changes time buckets:
\[\operatorname{recency}(v) = \begin{cases} 100 & \text{if visited in the past 4 days} \\ 70 & \text{if visited in the past 14 days} \\ 50 & \text{if visited in the past 31 days} \\ 30 & \text{if visited in the past 90 days} \\ 10 & \text{otherwise} \end{cases}\]Sites can be visited in many different ways. If the user typed the entire link themselves or if it was a bookmarked link, we want to weight that differently to visiting a page by clicking a link. Other visit types, like some types of redirects, should not be worth any score at all. We implement this by scaling the recency score with a type weight:
\[\operatorname{type}(v) = \begin{cases} 1.2 & \text{if normal visit} \\ 2 & \text{if link was typed out} \\ 1.4 & \text{if link is bookmarked} \\ 0 & \text{otherwise} \end{cases}\]Now that we can assign a score to every visit, we could determine the full points of a page by summing up the scores of each visit to that page. This approach has several disadvantages. For one, it would scale badly because some pages are visited a lot. Additionally, user preferences change over time and we might want to decrease the points in some situations.
Instead, we compute the average score of the last 10 visits. This score is then scaled by the total number of visits. The full frecency score can now be computed efficiently and changes in user behavior are reflected fairly quickly. Let \(S_x\) be the set of all visits to page \(x\), and let \(T_x\) be the set of the last up to 10 of these. The full frecency score is then given by:
\[\operatorname{frecency}(x) = \frac{|S_x|}{|T_x|} * \sum\limits_{v \in T_x} \operatorname{visit}(v)\]Note that this is a simplified version of the algorithm. There is some additional logic for special cases, like typing out bookmarks or different kinds of redirects. The description here only shows the essence of the algorithm in a mathematical form.
Optimizing Frecency
While frecency has been working pretty well in Firefox, the weights in the algorithm were not decided on in a data-driven way. Essentially, they are similar to magic numbers in software engineering. It is hard to understand why these exact numbers should be used. Even worse, there is no evidence that they are optimal. Maybe different time buckets or different weights would lead to much better results.
Our project replaces the constants by variables that we optimize for. This is done for all numbers in the previous section, except for two:
- number of considered visits (10): If this number increases too much, it would hurt performance. The current value represents a good trade-off between performance and using a sufficient amount of information
- number of time buckets (5): Optimizing this would be difficult with an approach based on gradient descent since this value affects how many variables there are. In the current implementation there was also no easy way of changing this
There are 22 remaining weights in the full algorithm that are optimized using our project. By doing this, more optimal values can be found, or it can at least be confirmed that the current ones were already chosen very well. It is also a safe way of experimenting with the Firefox URL bar: We start our optimization process from the current set of values and then try to improve them from there.
The optimization process is based on the users’ interactions with the URL bar. Each time they type into the URL bar, they are shown a set of suggestions that were ranked using our model. If they do not choose the top one, our model can use this feedback as a signal that it needs to change the weights to improve the rank of the selected item. Even if the top item was chosen, we can teach our model to be more confident in this decision. By using Federated Learning, we can make use of a lot such data, without sacrificing privacy.
SVM Ranking
To describe this goal formally, we need to have a loss function that evaluates how well our model did. To this end, we make use of a variant of the SVM loss, which we adapted for pointwise ranking. Essentially, the loss function takes a set of items with their assigned score and the index of the selected item. The optimization goal is that the selected item should have the highest score.
But even if that was the case, our model might not have been too confident in that decision. One example of this is the selected item having a score of 100 and the second item having a score of 99.9. The model made the correct prediction, but only barely so. To make sure it does a good job in similar cases, we need to provide a signal to the model which shows that it can still improve.
If the URL bar displayed the suggestions for pages \(x_1, \dots, x_n\) in that order and suggestion \(x_i\) was chosen, then the SVM loss for pointwise ranking is given by:
\[\operatorname{loss} = \sum\limits_{j \neq i} \max(0, f(x_j) + \Delta - f(x_i))\]We iterate over all suggestions that were not chosen and check that their score was smaller than the one of the selected page by at least a margin of \(\Delta\). If not, an error is added. The full loss should be minimized. The margin \(\Delta\) is a hyperparameter that needs to be decided on before the optimization process starts.
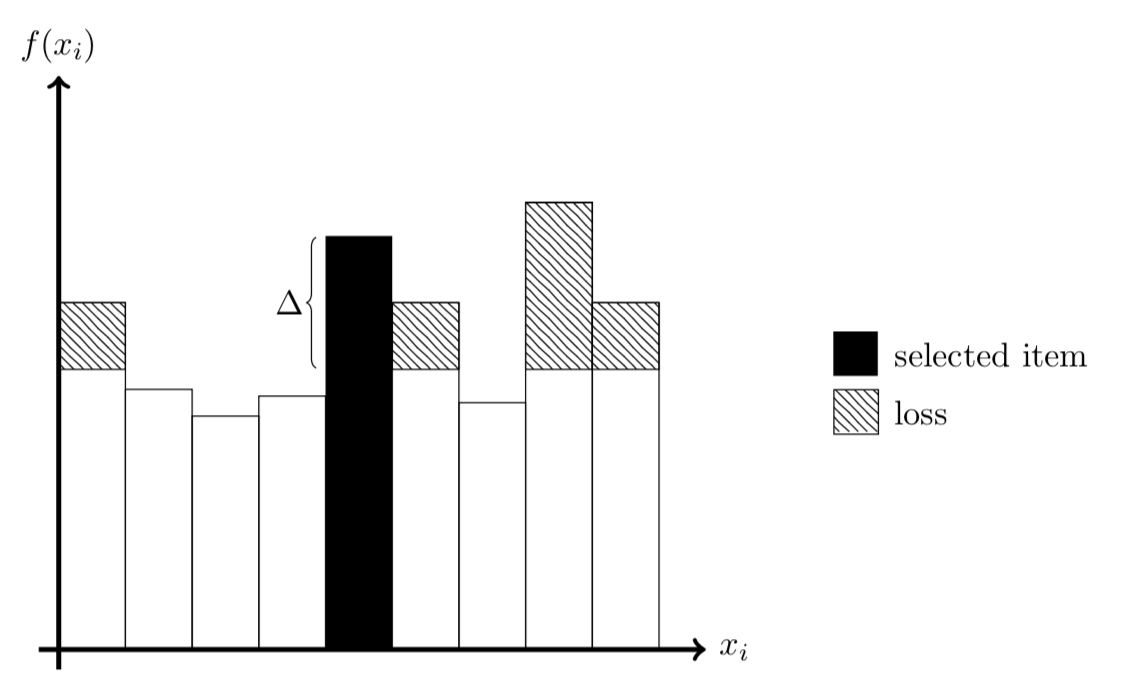 |
The image above shows a visualization of this loss function. Each bar represents a possible suggestion, with the selected one being shown in black. The y-axis displays how many points the model assigned to the respective suggestion. The hatched areas show the SVM loss. Everything above the selected suggestion and below it by a margin of \(\Delta\) adds to the full loss. Even though the selected suggestion had the second highest score, four suggestions contribute to the penalty.
Computing Gradients
Every time a user performs a history or bookmark search in the URL bar, we compute the SVM loss on that search. To compute an update, we then try to move the weights a little bit into a direction where this loss is minimized. The update corresponds to the gradient of the SVM loss with respect to the weights in the frecency algorithm that we optimize for.
Gradients can be computed elegantly using computational graphs. By using machine learning libraries, we first construct the function we want to compute. Afterwards, we can make use of automatic differentiation techniques to obtain the gradient. Our initial prototyping was based on this idea. The major advantage is that it is very easy to change the model architecture.
The current frecency implementation in Firefox, however, is written in C++, while the client-side part of this experiment works using JavaScript. To launch the experiment, the Firefox SHIELD mechanism was used. SHIELD allows us to directly send new code to Firefox clients, without having to go through major version releases, which only happen every few weeks. To be able to do this, SHIELD experiments have to be written in JavaScript and can only make very limited use of C++ components.
This made it hard to add a computational graph to the existing C++ frecency module. Reimplementing the full algorithm in JavaScript seemed like a bad idea. Performance-wise there would be a huge penalty and it is hard to reconstruct the way the current implementation handles all the edge cases.
Instead, we decided to use a simple finite-difference technique. If we want to compute the gradient of a function \(g\) at the point \(x\), we check the difference of values close to that point:
\[g'(x) \approx \frac{g(x + \epsilon) - g(x - \epsilon)}{2 * \epsilon}\]This formula is very close to the definition of derivatives. To compute the gradient of a multivariate function, this process is then performed by iterating through all dimensions independently. In each dimension, the value is changed by \(\epsilon\) in the two directions, while all other values stay constant. The resulting vector is our gradient estimate.
This method is both easy to understand and implement. It is simple to change the frecency weights in our experiment without changing the actual algorithm. For large models there is a performance penalty since we need to evaluate \(g\) two times for every dimension. In \(n\) dimensions, there are \(\mathcal{O}(n)\) function evaluations as opposed to \(\mathcal{O}(1)\) for computational graphs. But since we only work in 22 dimensions here, this is not a major problem.
The finite-difference method also allows us to essentially treat frecency as a black box. Our model does not need to know about all edge cases. It is sufficient for the model to see how different decisions affect the output and the loss.
Data Pipeline
The addon we built observes how users are interacting with the URL bar and retrieves all necessary information to compute the gradient. That update and some statistics about how well the model is doing are then sent to a Mozilla server. This works by using the Telemetry system, which has several advantages. It is a well-designed system with clear rules about what can be collected. There is a lot of infrastructure around using it and dealing with the data on the server.
All messages sent by clients are stored in a Parquet data store. A Spark MapReduce job reads the new updates and averages them in real-time. Every 30 minutes, the average update is then given to an optimizer and applied to the model. The resulting model is published to S3 and fetched by clients.
Updating the Model
One central problem with applying the update to the model is choosing the hyperparameters of the optimizer. Since we did not collect any data, it is hard to tune the optimizer beforehand. Even values like the learning rate are hard to set since we have no information about the gradient magnitude. Trying out many different learning rates in production would take time and could lead to a bad user experience. Directly collecting some data conflicts with the goal of doing machine learning in a privacy-respecting way.
We tackled this problem in two ways. First of all, we created simulations which use a made-up dataset that should be similar to the one we expect to see in production. This allowed experimenting with different optimizers and helped with making early design decisions. It also made it possible to quickly iterate on ideas to see if they could work.
The second way of dealing with the fact that it is hard to set hyperparameters was using the RProp optimizer. This optimizer has major advantages in our case:
- It completely ignores the gradient magnitude and only takes into account the signs of the gradient. This means it will work with any sort of gradient we could see in production. We do not have to worry about properly scaling it
- It automatically adapts internal learning rates based on how well they work. So even if the initial values are off, they will move to decent ones in a few iterations
- The updates produced by RProp are very interpretable. In our case, we make sure they are 3 at most, so that frecency scores only change slowly
After RProp produces an update, we still apply several constraints to it.
- Weights have to be nonnegative. This means visiting a site cannot directly have a negative effect
- The time buckets have to be sorted by the last day they take into account. In other words, the \((i + 1\))-th time bucket needs to contain older visits than the \(i\)-th time bucket. This is to ensure that the client-side frecency implementation continues to work
These essentially act as safeguards to make sure that user experience does not degrade too much if the optimization process fails.
Study
Users in the experiment were split into three groups:
- treatment: The full study was shipped to these users. They compute updates, send them to the server, and start using a new model every 30 minutes
- control: This group is solely for observational purposes. No behavior in the URL bar actually changes. We are just collecting statistics for comparison to treatment
- control-no-decay: Firefox decays frecency scores over time. Our treatment group loses this effect because we are recomputing scores every 30 minutes. To check if the decay is actually useful, this group has no decay effect but uses the same original algorithm otherwise
The study was shipped to 25% of Firefox Beta users who had Telemetry enabled. As with all other SHIELD studies, only users with Telemetry enabled were eligible for enrollment. 60% of the users in our study were assigned to the treatment group, while the other 40% were split among the two control groups.
Metrics
To evaluate how well our trained model works, we had three success criteria:
- Do not significantly decrease the quality of the existing Firefox URL bar
- Successfully train a model using Federated Learning
- Stretch goal: Improve the Firefox URL bar
Actually improving the quality of the ranking for users was only a stretch goal. The primary goal of the study was to see if it is possible to make the distributed optimization process work. Essentially this meant consistently decreasing the loss of the model. At the same time, the quality of the URL bar should not decrease. The reason for distinguishing between these is that our optimization goal could have been misaligned. It is possible to minimize some loss function without actually improving the experience for the user.
To measure the quality of history and bookmark suggestions in the URL bar, we used two metrics:
- Number of characters typed before selecting a result: Users should have to type few characters to find what they are looking for
- The rank of the suggestion that was selected: The item that is selected should be as far on top as possible
If the quality of any of these two metrics increases, we consider the stretch goal to be reached. We were not entirely sure if both metrics could be improved. One theory for this was that maybe users always type a similar number of characters before choosing one of the suggestions. The alternative could also be possible, users always type until the first suggestion displayed is the one they were looking for. For this reason, we decided that for the third goal only one of the metrics would need to be improved, while the other should not get much worse. The first goal meant that both metrics should not get significantly worse.
Power Analysis
Power Analysis is an important part of designing studies. It tries to answer the question of how many people are required to get statistically significant results in an experiment. If too few people are enrolled, the results will contain too much random noise to rely on them. If a lot of people are enrolled, we can be confident in the results but the cost of the study will be much higher.
In the case of Firefox, this cost consists of two factors. For one, if our study enrolls most Firefox users, we would block other studies that want to experiment with changes in the URL bar. Another reason is that the experiment might break parts of Firefox. If this happens, it should not affect unnecessarily many people.
For this reason, we performed a power analysis to decide on our sample sizes for treatment and control. Concretely, this analysis consisted of two parts:
- How many users do we need to have enough data to train a model?
(relevant for treatment) - How many users do we need to show certain effects confidently?
(relevant for treatment and control)
The first part was answered using simulations. By using an adapted form of the simulation we used to decide on optimization hyperparameters, we could get some idea on how many users we would need. Existing Telemetry data was helpful for this, as it allowed us to get some idea of how many history searches people perform every day.
The second part of the power analysis was tackled using classical hypothesis testing. There was no prior data on the number of typed characters, so no power analysis was possible for this metric. To analyze the rank of the selected item, the Mann-Whitney-U test was used since the data was not following a distribution that allows for parametric tests. The Mann-Whitney-U test is non-parametric, which means that it does not make any assumptions about the underlying distribution of the data. This analysis turned out to be pretty helpful since we realized that our control groups could be smaller than the treatment group.
Analyzing the Results
Over the course of the experiment, 723,581 users were enrolled in the study. The model was fetched 58,399,063 times from the server. 360,518 users participated in sending updates and evaluation data to the server, accounting for a total of 5,748,814 messages. The optimization phase of the experiment consisted of 137 iterations of 30 minutes each, or just under three days. In this phase, 186,315 users sent pings to help in the training process.
A separate phase of purely evaluating the model was started afterwards and took a total of 10 days. In this phase, 306,200 users send 3,674,063 pings, which included statistics detailing how well the model worked for them. Since all these users were assigned to treatment or control groups, the new model can be compared well to the old one that was used by the control groups. Some users were enrolled but did not help with optimization or evaluation because they performed no history and bookmark searches.
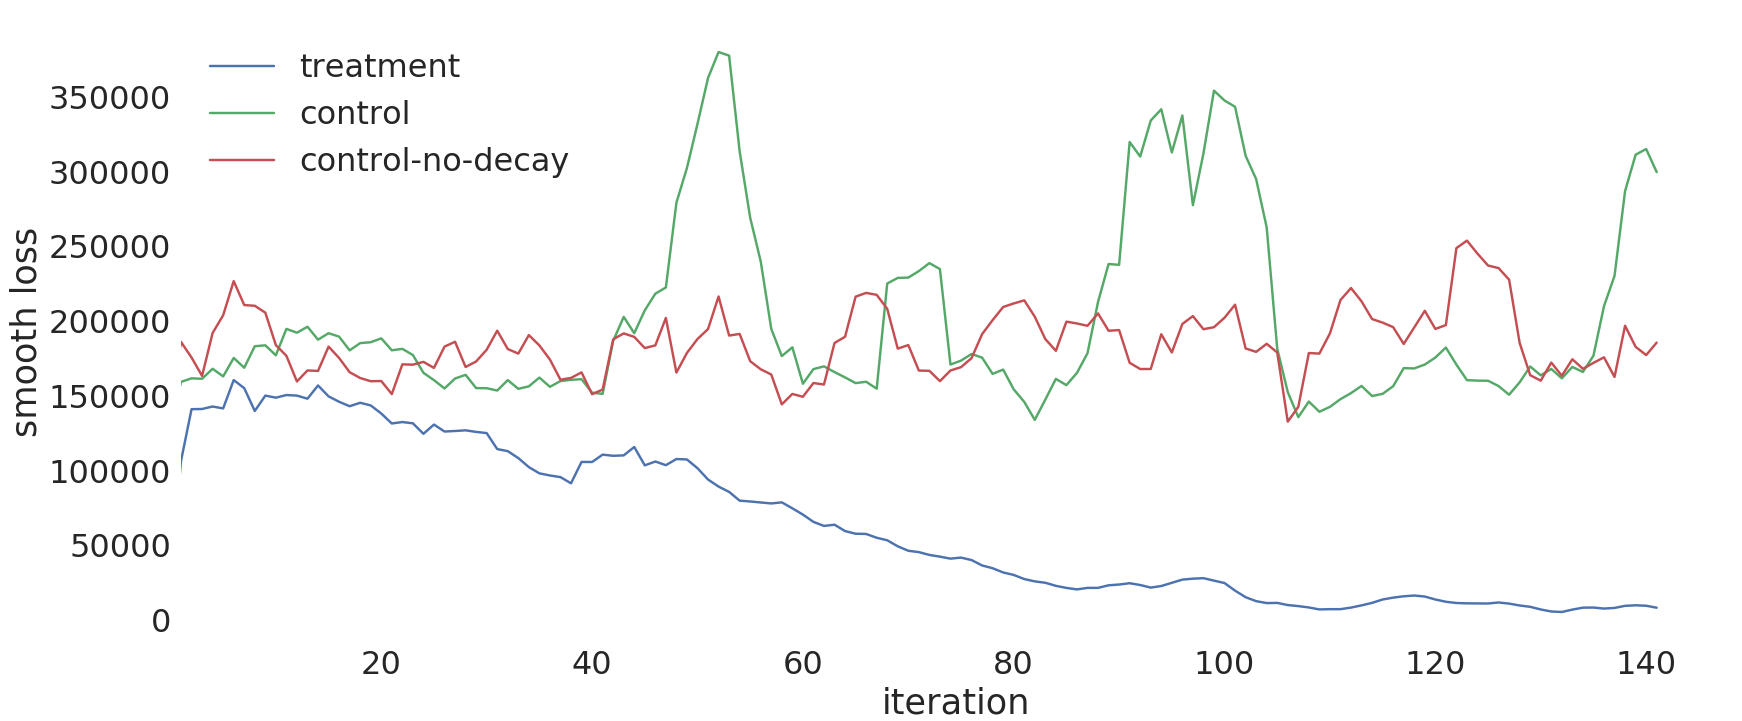
During the optimization process, the loss of the model was supervised to check how well the training was going. The plot below shows how the loss changed over time, across all three study variations. There is some noise in this plot, since each iteration only had a very limited number of users. However, it can still be seen that the loss of the treatment group goes down continuously. This shows that the optimization process generally worked. After 40 iterations, less than one day of optimization, the loss of the treatment group is significantly below the loss of the control groups. The second goal of the study was thus reached.
 |
After the optimization process ended, an evaluation phase began to determine how well the new model works. This is equivalent to the testing phase in machine learning. The model is evaluated on new data that was not used for training or validation. The table below shows the results. On average, users in the treatment group type about half a character less to find what they are looking for. This is a strong improvement over both control groups. However, users in the treatment group also choose suggestions that were ranked slightly worse. Hypothesis testing determined that the changes in the treatment group were highly significant, with p-values being below 1e-75.
| study variation | mean characters typed | mean selected rank |
|---|---|---|
| treatment | 3.6747 | 0.37435 |
| control | 4.26239 | 0.3535 |
| control-no-decay | 4.24125 | 0.35771 |
From a user perspective, it is not clear if these changes improve the user experience. While users now have to type a good amount less, they also selected suggestions that were not on top of the list more often. One potential explanation for this could be that the items they were looking for are displayed earlier in the suggestion list. Since they spent less time typing, they might be willing to take the time to select an item that is not the top ranked one.
It is hard to determine purely based on these two metrics if this change is good, since it is not clear how their importance should be weighted. Instead, surveying users would be required to decide if goal 3 was met. But even if users are not satisfied with the new model, the Federated Learning system is still highly useful. Since the optimization process works well, one would only need to find a loss function that correlates more closely with what users want. We consider goal 1 to be reached since at least one of the metrics improved.
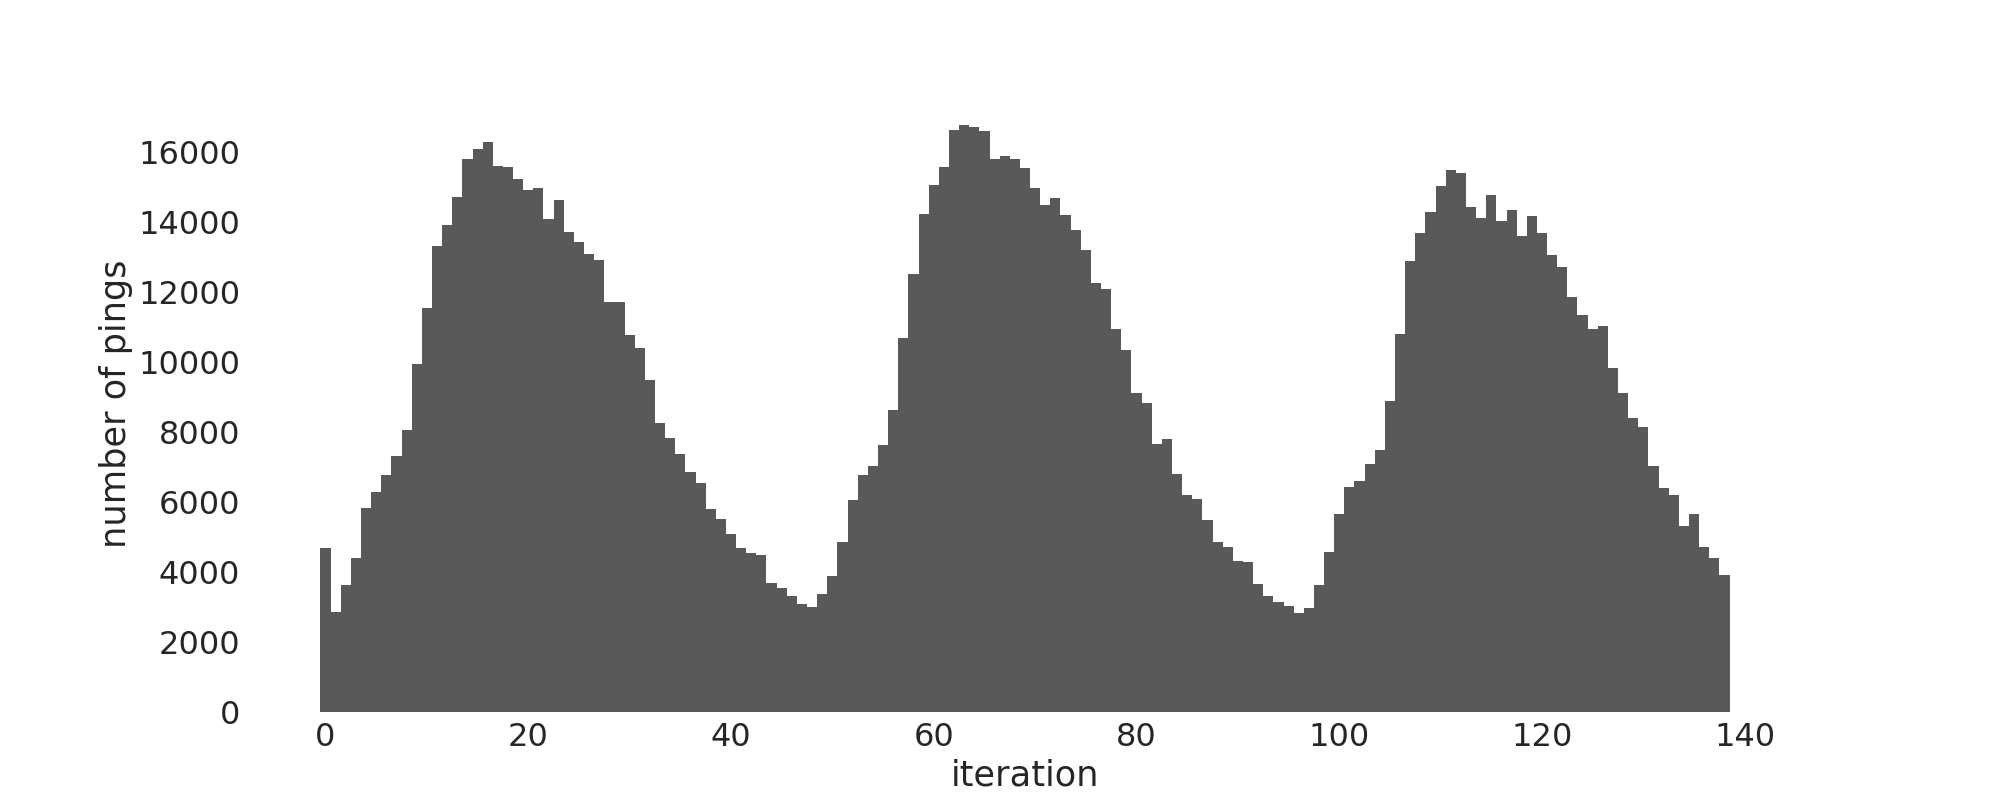
To learn from this experiment for further Federated Learning studies, we additionally analyzed all the update data later on. In retrospect, the Federated Learning protocol we used was too simple. The plot below shows how Firefox beta activity in our study varies over time. The protocol could be improved by dynamically determining the iteration length depending on how many updates were sent to the server so far. This way, there would be no iterations with very few updates. Furthermore, there could be more iterations during periods with many active users, allowing for a faster optimization process.
 |
A more sophisticated protocol could adapt the iteration length depending on how stable the current update estimate is. We noticed that the later iterations of the optimization process require much fewer reports to compute a good estimate. The plot below compares the update we actually used to updates we would get by randomly sampling 2,000 of these update reports. The \(L_1\)-distance is used to perform this comparison. Because of the randomness, the mean and standard deviation after 50 such simulations per iteration are reported.
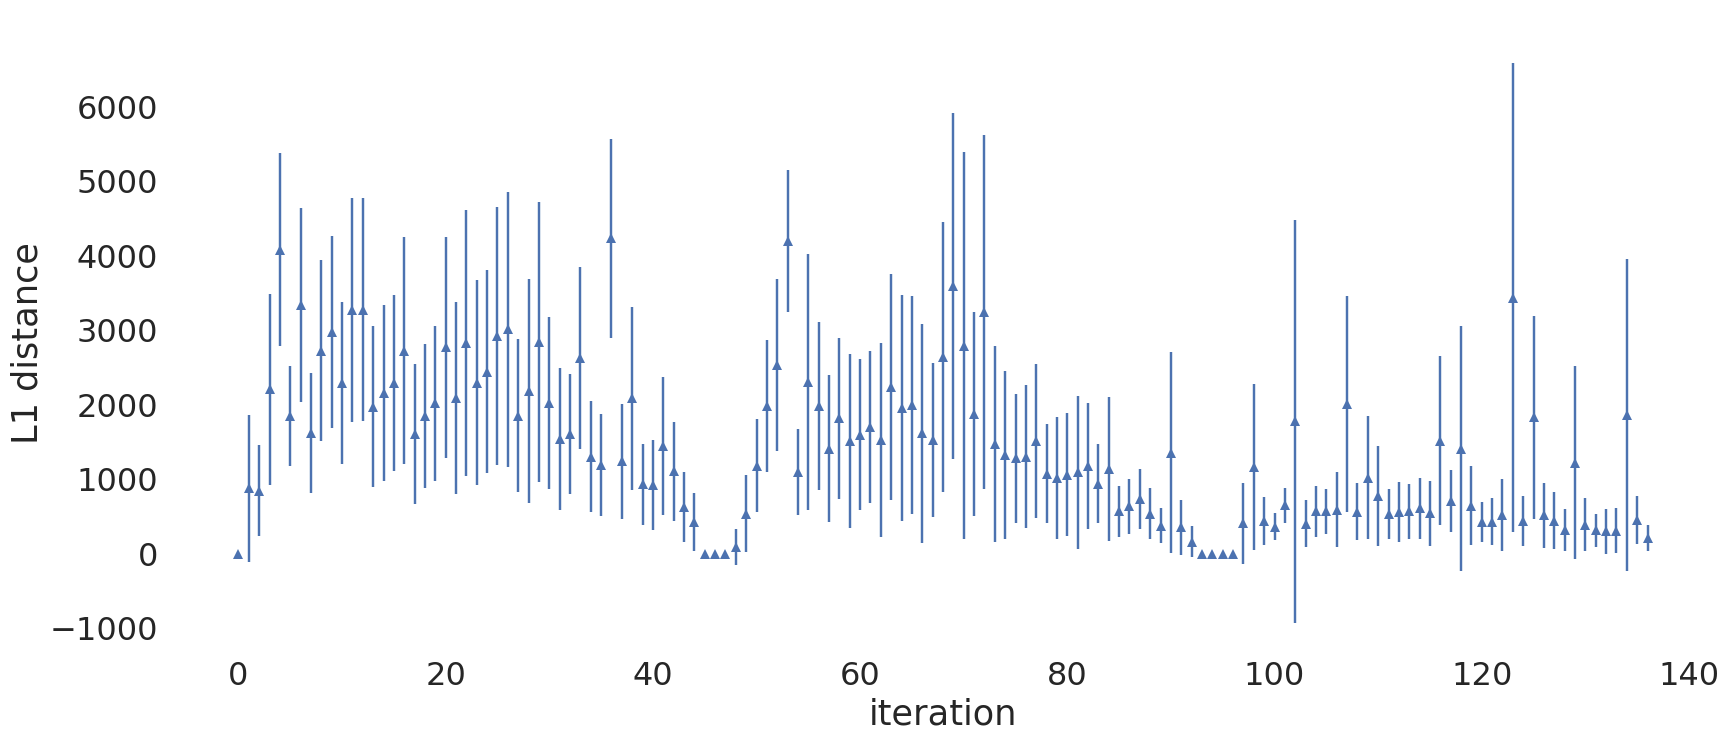 |
It can be observed that the estimates become much more stable after iteration 100. While the \(L_1\)-distance of two updates can be large without affecting the RProp optimizer much, this is still an interesting result. We observed similar results for the loss estimates.
Future Work
There is still a lot of low-hanging fruit in this Federated Learning system. For one, the protocol could be made much more sophisticated, as explained above. Furthermore, when trying to interpret the new weights, it seems like it would be a good idea to introduce additional weight constraints to make better use of the time buckets.
To be able to implement the entire system in three months, a lot of simplifications had to be done. This is why our resulting model has few weights and is easy to interpret. If more time could go into this project, a language model would be interesting because it would allow tackling the problem directly from a query matching angle. Instead of making suggestions based on the current query, we could base them on what the model thinks the user is going to type next.
Finally, there are other applications for Federated Learning in Firefox. Based on user interactions with Firefox, our system could really optimize anything that currently relies on hardcoded constants.
Open Source Code
Nearly the entire code of the Federated Learning system is open sourced:
- Firefox addon that implements the client-side part of the system
- Server-side implementation which computes the next model
- Simulations for experimenting with Federated Learning
Only a few analyses based on Firefox interaction data are not publicly available.
Thanks!
This project would not have been possible without the help of many people:
- Sunah Suh planned out the project with me and helped to resolve many blockers along the way
- Arkadiusz Komarzewski ported the Python optimizer to Scala and implemented the remaining server-side logic
- Drew Willcoxon and Rob Helmer helped a lot with Firefox specific parts of the project
- Tim Smith provided most of the code for using the Mann-Whitney-U test and along with Ilana Segall answered many questions related to power analyses
- Jeff Klukas always had an open ear when I ran into problems and helped out when Sunah was on vacation
- Katie Parlante made it possible for me to return to Mozilla to work on this and was very open to my ideas for projects
Thanks a lot for all your help and support!